Zoom
Zoom In:
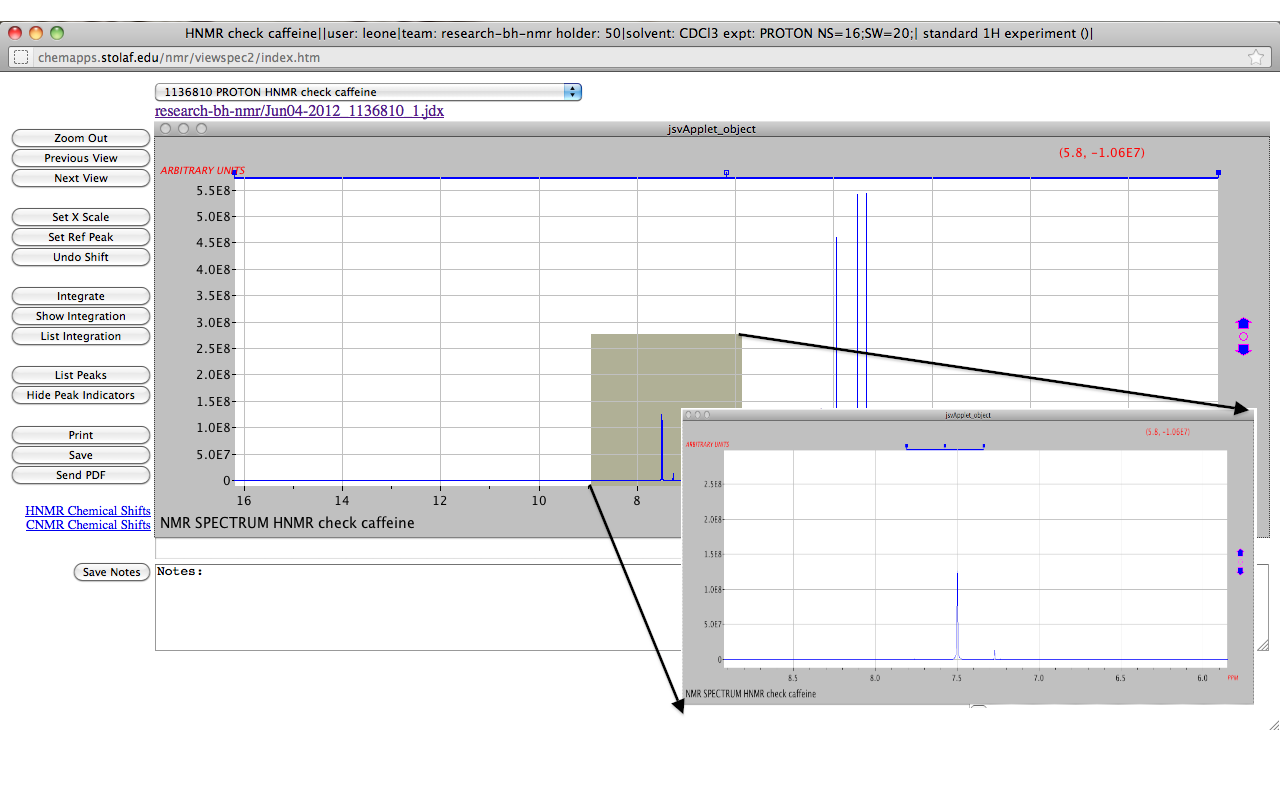
Click and drag over the area of choice, a grey box will appear. Upon release of the mouse, the applet expands the highlighted region (image 1).
Use the blue bar on the top of the grid, move the blue boxes on the ends of the bar to adjust the x-axis of the applet, or use the Set X Scale button to enter the dimensions for the x-axis.
Command = zoom x1,x2 (ex: zoom 0, 10)
To resize peak height only use the up/down arrows on the right of the screen.
Zoom Out:
Click the zoom out button to bring spectrum back to original axis.
Click the center circle between the up/down arrows on the righthand side of the applet to bring the spectrum back to the original axis, and the peaks back to original their height.
Click the Previous View button to go back to the most recent zoom orientation, the Next View button will undo the "previous view" action.
Command = zoom out
Measurements:
Double click on or near a peak, then move your mouse to begin measuring. A second double click will end the measurement(image 2).
Integration:
Click the Integrate button to automatically calculate the integral measurements: command = integrationauto (image 3a). Clicking on the button again (now Clear Integration) will remove the values.
To change the integration measurements: either place cursor over the integration line, click and drag, or hold down the control key (command key for mac users) and drag the mouse(image 3b).
List Integration opens a dialogue box containing the integration values (image 3c). To update integration value changes made on the spectrum, hit the Apply button on the dialogue box.
To remove a specific integral value, hover the mouse over the integral value and press escape. To remove all integral values in the view hover the mouse over a value and press delete.
To normalize the values--hover the mouse over a specific value and press the 'N' key, or click on the number and change the value in the pop-up box (image 3d).
Click the Hide Integration button to remove the integration line from the screen, a second click on the button (now Show Integration) will bring the line and the values back.
To adjust the appearance of the integration line hover the mouse over either end point of the integration line; the left side vertically adjusts the placement of the line (image 3e), the right side will adjust the height of the line (image 3f).
Peak Listing:
Click the List Peak button to display all peak values, as well as any coupling constants (image 4). On the spectrum a small red lines appear at the top to represent defined peaks. These lines become the values shown in the dialogue box when printing the spectrum.
To change the Threshold (the height at which peaks are detected, indicated by a red horizontal line) either enter a different value into the Threshold box in the dialogue box, or click on a new location on the spectrum. After closing the Peak dialogue box, clicking on the spectrum will not change the threshold.
Click the Hide Peak Indicators button to remove the small red indication lines. To show the lines again, click on the same button a second time (now Show Peak Indicators).
Set Reference Peak:
Click the Set Ref Peak button, then follow the prompts given to set the reference peak which adjusts the chemical shift of all the lines (image 5).
To undo the chemical shift, either press the Undo Shift button, or reclick Set Ref Peak and leave the entry bar of the pop-up box blank.
Print:
The Print button allows the user to print the image displayed on the applet, the red lines at the top will show peak values (image 6).
Command = print
Save:
The Save Integration button updates the file so that it contains the integration values, and peak values. When the spectra is opened at a later time the values will remain.
Notes can be saved as a conversation between users by adding a line over the previously saved notes (see notes of image 3e, and image 3f).
Send PDF:
The Send PDF allows the user to send the saved version of their PDF and notes via email to any recipient.
The Saved Notes will be sent in the content section of the email.
A link to the JDX file will also be sent in the email.
|